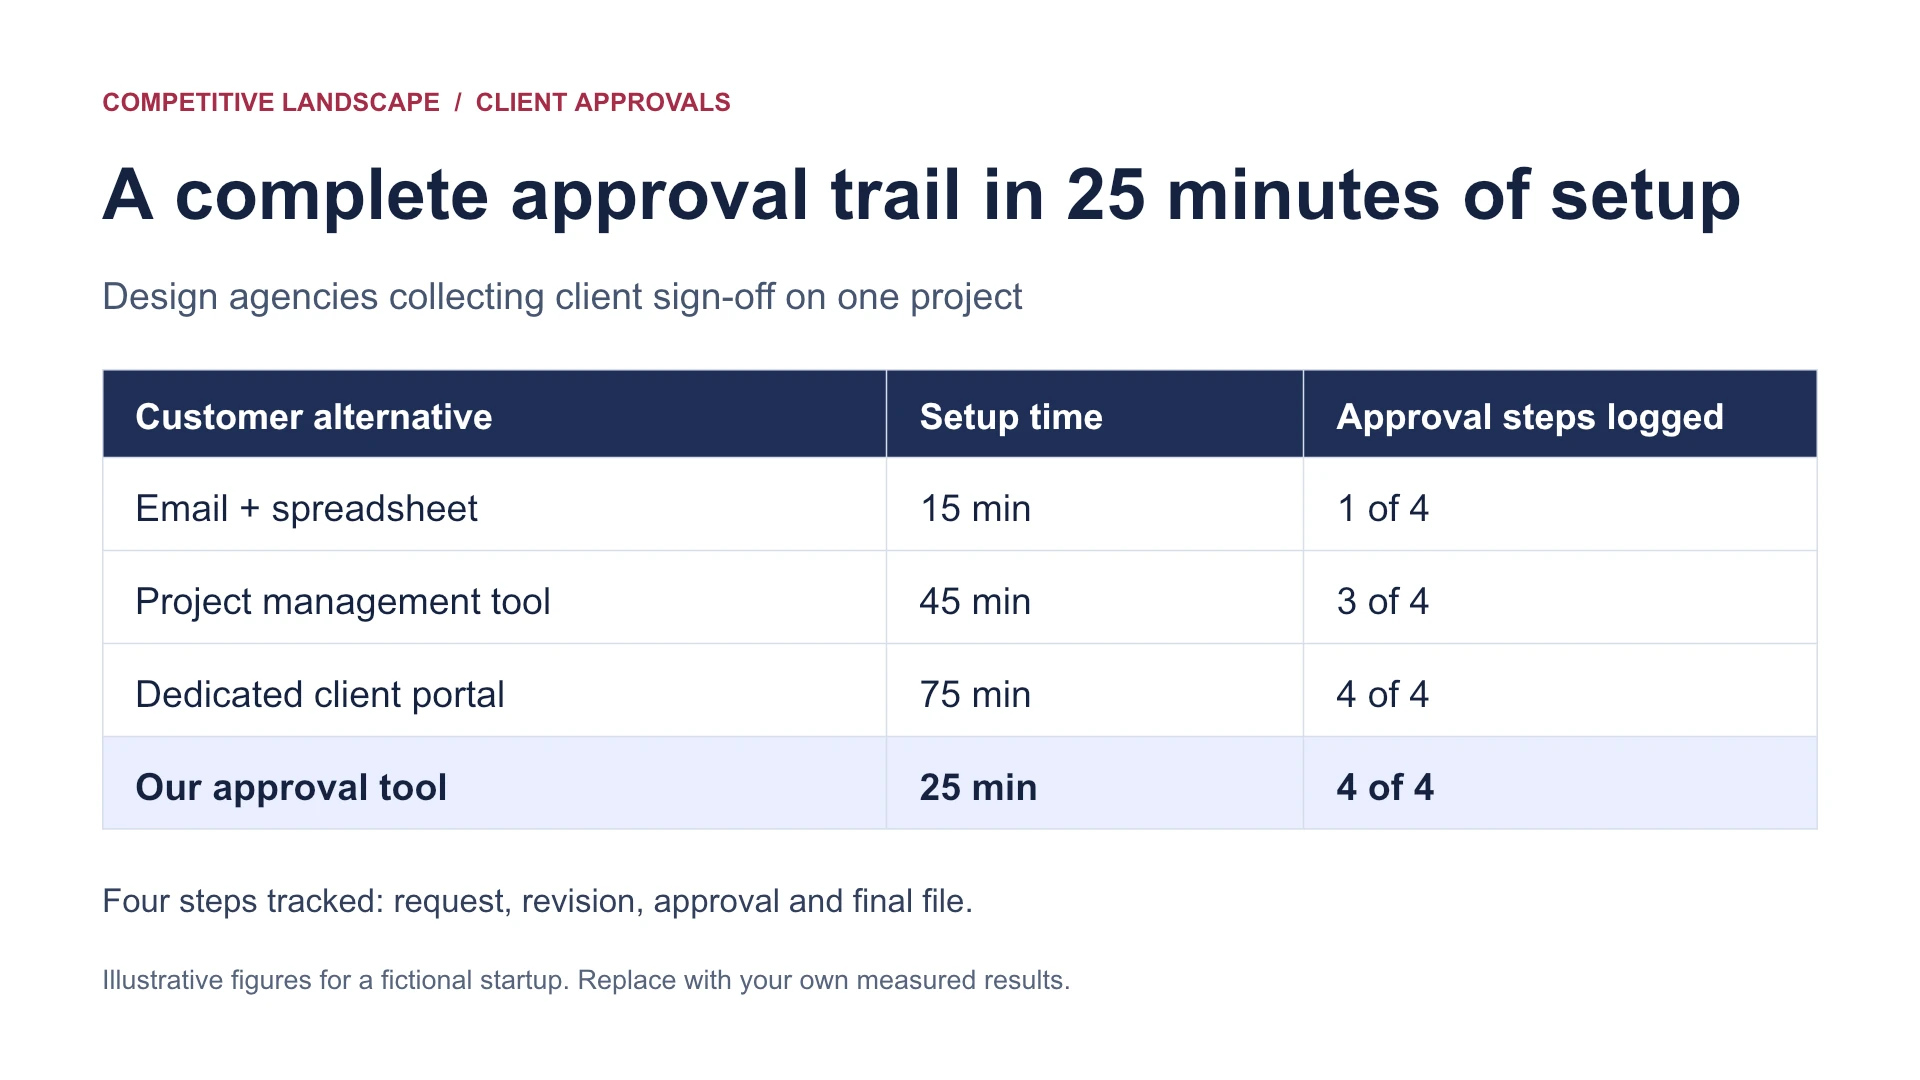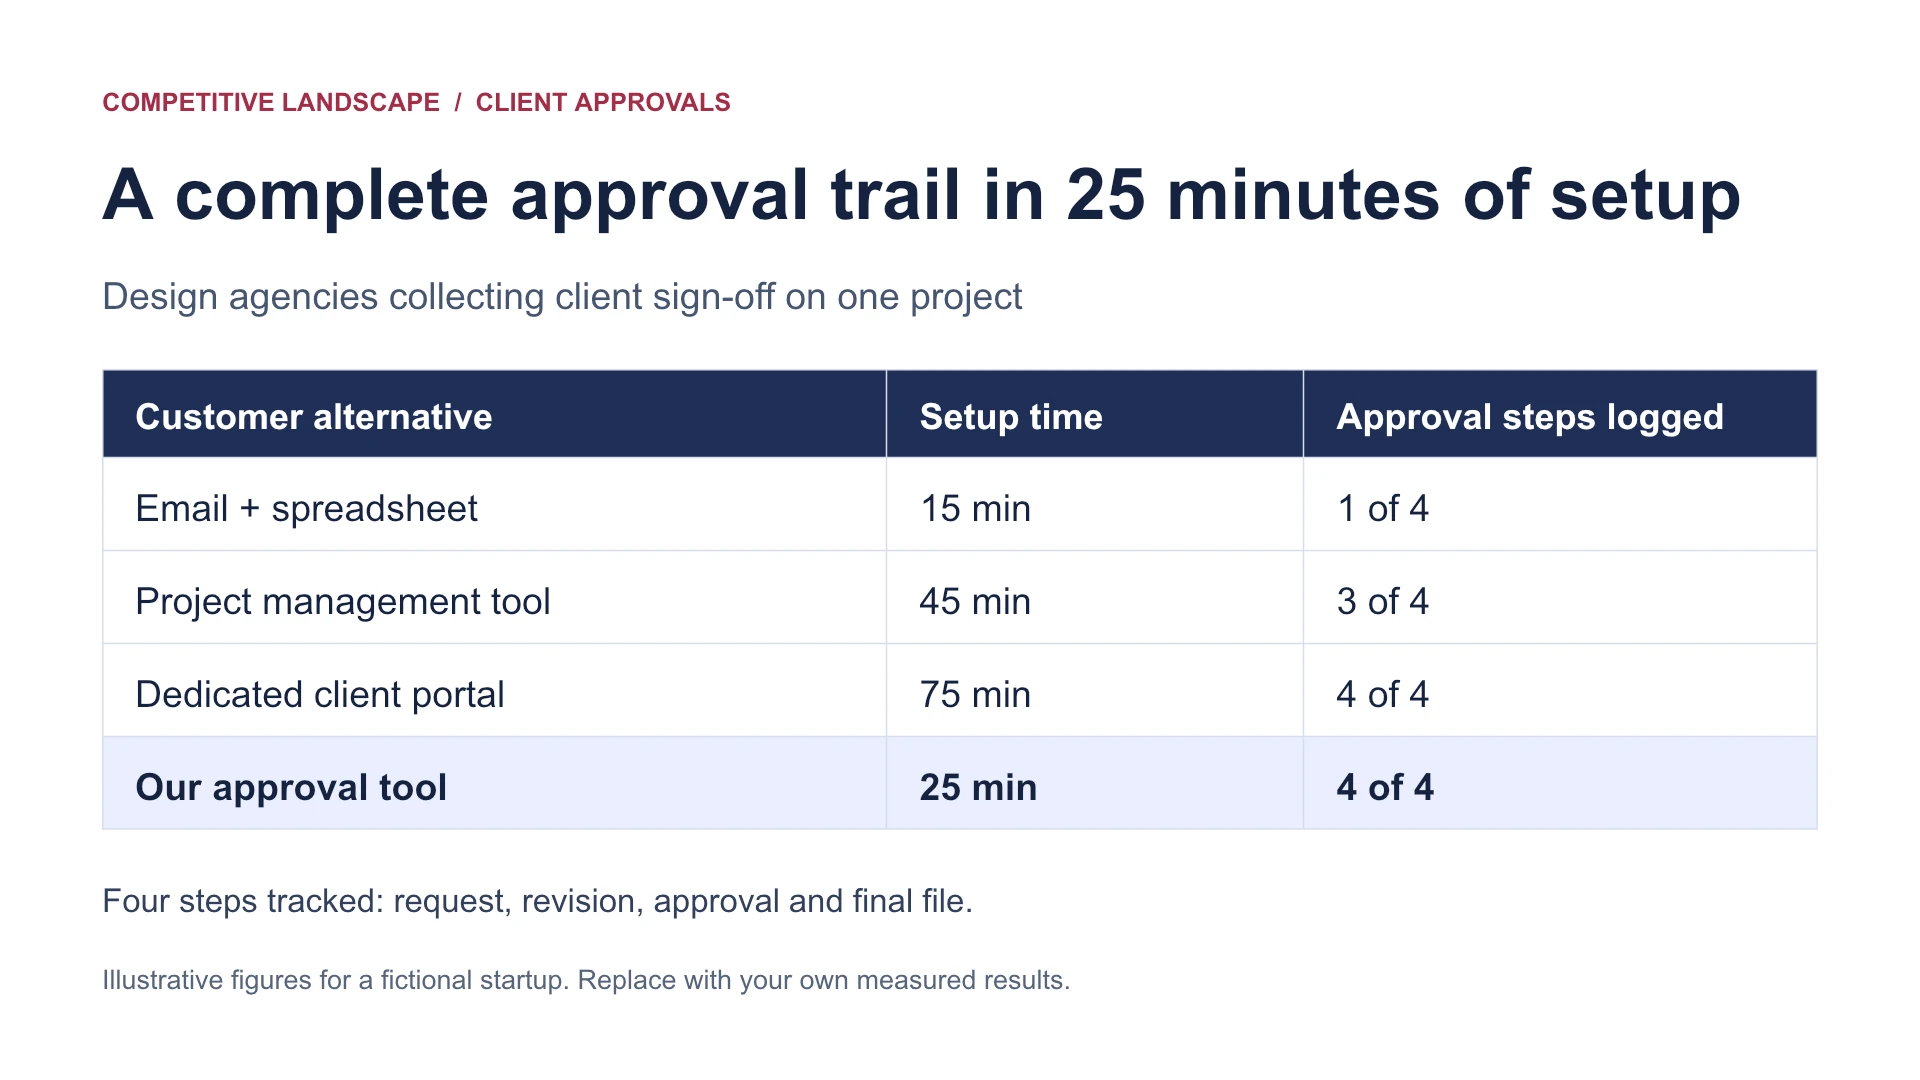
The slide above uses fictional figures for a startup that helps design agencies get client sign-off. The table, title and text are editable in the PowerPoint file.
Download the editable slide (.pptx)
Open the PowerPoint file and copy the slide into your deck. Open the full-size slide image.
Use a table when buyers compare specifics
A small agency can get sign-off over email, use the project management tool it already pays for, or set up a dedicated client portal. The slide compares those choices with a fictional approval tool on two questions that matter to the buyer. How long will setup take, and how much of the approval history can the agency find later?
| Customer alternative | Setup time | Approval steps logged |
|---|---|---|
| Email + spreadsheet | 15 min | 1 of 4 |
| Project management tool | 45 min | 3 of 4 |
| Dedicated client portal | 75 min | 4 of 4 |
| Our approval tool | 25 min | 4 of 4 |
Start the timer with an empty project and stop when the first request is ready to send. Then run the same approval workflow and count the steps you can find in one record. In this example, those steps are request sent, revision requested, approval given and final file linked.
Email is quickest to set up. The portal matches the startup’s complete record. The startup’s proposed advantage is getting that same record with less setup than the portal. The table makes both the advantage and the trade-off visible.
Use a 2×2 when two criteria tell the story
Put setup time on the horizontal axis and approval history on the vertical axis. For this example, suppose the agency has half an hour to set up a project and needs a record of all four steps. Use those requirements as the dividing lines.
| Approval history | Setup ≤ 30 min | Setup > 30 min |
|---|---|---|
| All 4 steps | Our approval tool · 25 min · 4 of 4 | Dedicated client portal · 75 min · 4 of 4 |
| 0–3 steps | Email + spreadsheet · 15 min · 1 of 4 | Project management tool · 45 min · 3 of 4 |
The matrix makes it easy to see which option meets both requirements. The table is better when the exact time difference matters or when you need to show more than two criteria. Choose cutoffs that come from how customers buy. If you can’t explain the cutoff to an investor, keep the exact values in a table.
Build your slide from a customer decision
- Find what customers would actually use. Ask what they do today and what they considered the last time they switched. Include the manual workaround if it comes up.
- Pick a test that reflects the job. Compare each option on the same task and record the date, plan and assumptions. For an approval tool, run one project through each option with the same four steps.
- Write the headline last. Use the clearest difference the evidence supports. If one rival is faster or cheaper, make that visible and explain which buyers still choose your product.
Check the slide before you share it
- Can someone name the buyer and the alternatives after one quick read?
- Can you point to the source for every number or claim, including any gap in the evidence?
- Does the headline describe a difference the table or matrix actually shows?
For more on naming direct and indirect alternatives and keeping each slide easy to read, see the pitching guides from Sequoia and Y Combinator.
FAQ
What if I have no direct competitors?
Show the way buyers handle the job today. In the example, email and a spreadsheet can handle the same job together.
What if I haven’t measured one of the alternatives?
Mark that cell as unknown and explain what you’ll verify. Leave the option off the matrix until you have enough evidence to place it.

Affiliate Disclosure: Some of the links in this article may be affiliate links, which can provide compensation to me at no cost to you if you decide to purchase a paid plan. This site is not intended to provide financial advice and is for entertainment only. As an Amazon Associate I earn from qualifying purchases.